NASA Earth Observatory image by Joshua Stevens, using GOES 17 imagery courtesy of NOAA and the National Environmental Satellite, Data, and Information Service (NESDIS), and GEOS-5 data from the Global Modeling and Assimilation Office at NASA GSFC. Edited from story by Kathryn Hansen.
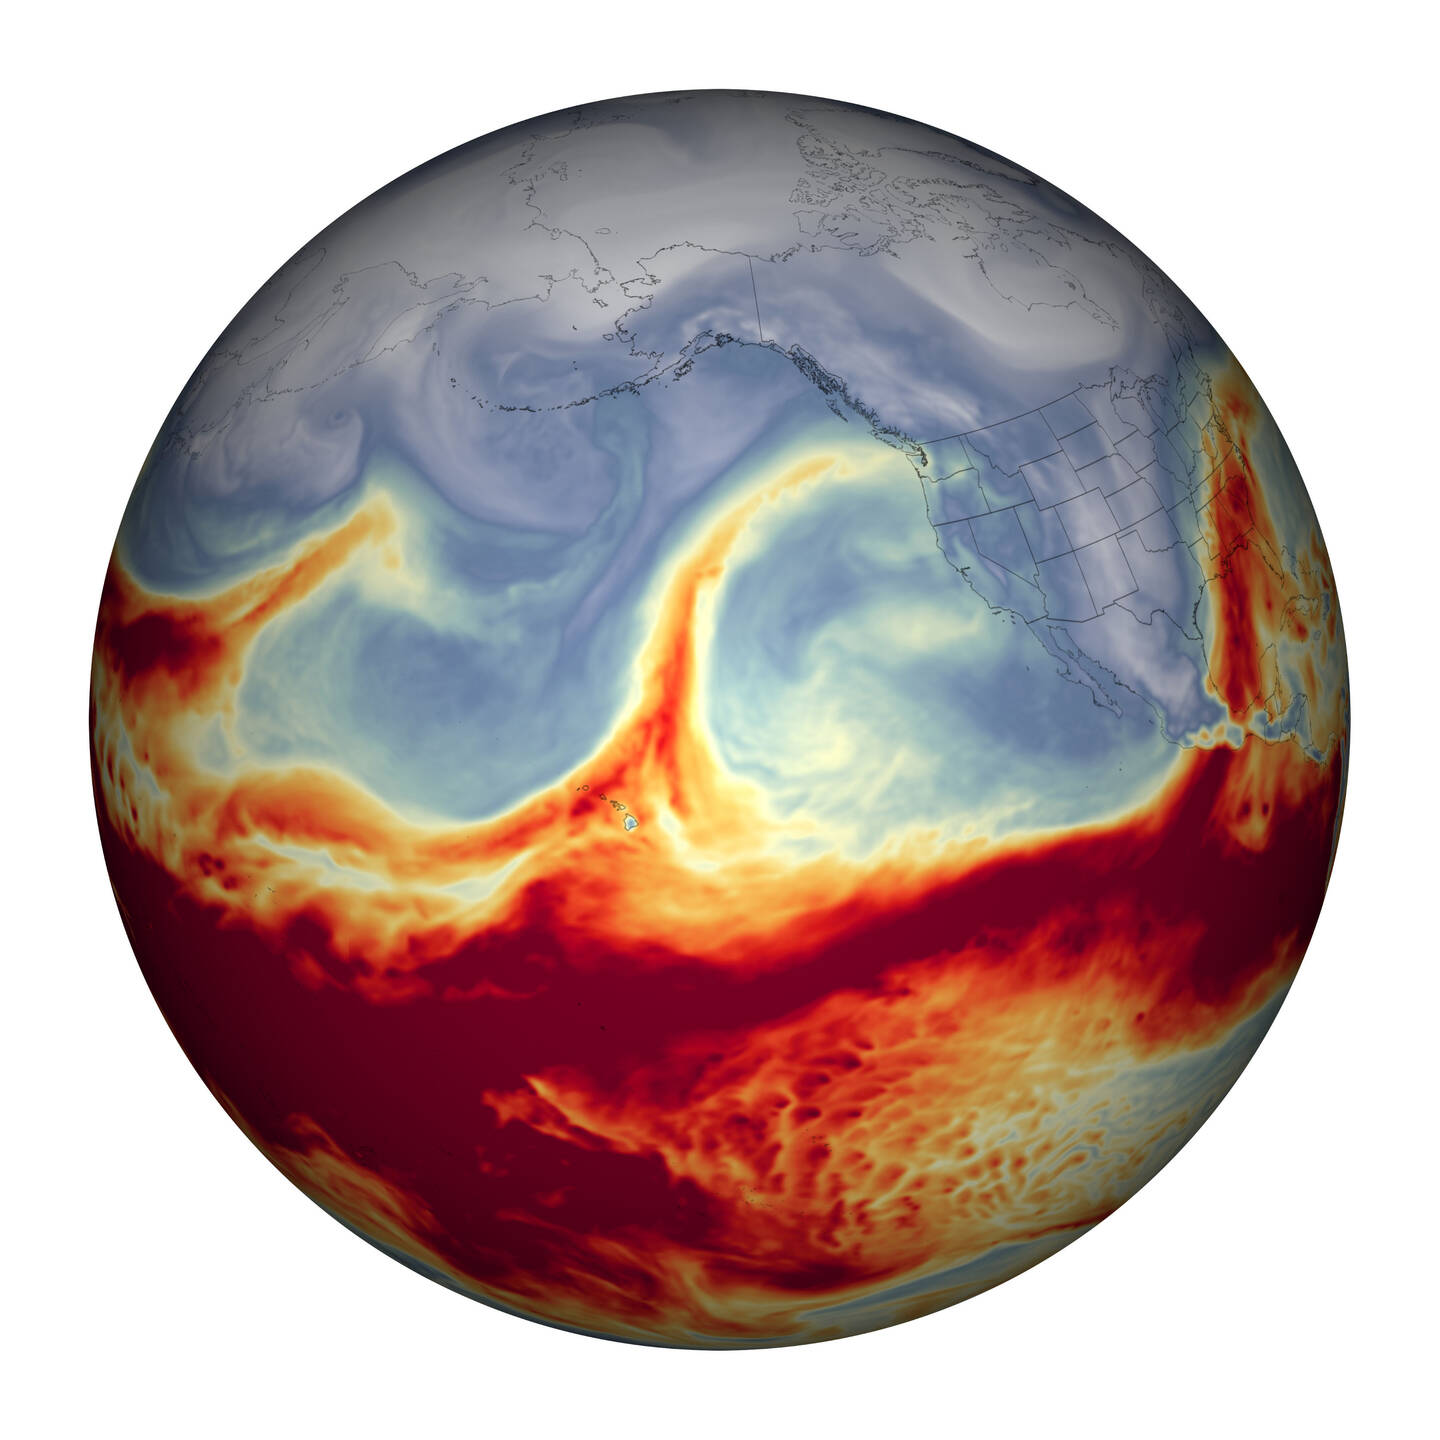
January 2020 in the Pacific Northwest was exceptionally wet. Rainy conditions continued through the first week of February, when a stream of water vapor from the tropical Pacific moved even more moisture into the region. This map shows the total precipitable water vapor in the atmosphere at 1 a.m. Pacific Standard Time on February 6, 2020. Total precipitable water vapor is the depth of water in a column of the atmosphere if all the water vapor in that column were condensed into liquid. Red areas represent the highest values of precipitable water vapor. The precipitation from atmospheric rivers accounts for up to 50 percent of all rain and snow that falls in the western United States.